US Pet Tech Industry Overview
Overall Pet Industry & Demographics
The American Pet Products Association (APPA) is the source for much of the published statistics about the US pet industry. Every other year, the APPA surveys over 10,000 pet owners about their pets, activities and purchasing habits.
The APPA survey found that there were approximately 90 million dogs and 94 million cats in the US in 2016. There are 126 million households in the US, with 60 million having at least one dog (1.5 on average) and 47 million having at least one cat (2 per average.)
The APPA determined that the total US pet expenditures in 2018 was $72.56 billion. This amount is broken down into the following categories: Pet food – $30.32 billion, Supplies/OTC medicine – $16.01 billion, Vet Care – $18.11 billion, Pet Services – $6.11 billion and Live animal purchases = 2.01 billion.
John Gibbons, also known as The Pet Business Professor, also publishes stats on the US pet market. He finds that in 2018, US consumers spent $78.6 billion on their pets. He breaks down the numbers as follows: Pet food: $28.85 billion, Pets & supplies $19.8 billion, Vet care: $21.23 billion and pet services: $8.72 billion. Gibbons uses the US BLS Consumer Expenditure Surveys to arrive at his findings.
Packaged Facts (PF), a leading research publisher, found the US pet market to be somewhat higher, putting sales at $86 billion. Because we don’t want to spend several thousand dollars to purchase the PF report, we do not know how they break down the categories. However, we can find a few conclusions listed in the report descriptions: 1) PF estimated the pet supplies market at $15 billion in 2015, and, 2) PF estimated the durable dog and cat products market at $4.9 billion in 2017.
| APPA | Pet Business Professor | Packaged Facts | |
| Food | $30.32 | $28.85 | |
| Supplies/OTC medicine | $16.01 | $19.80 | $15 (which includes $4.9 durable goods) |
| Vet Care | $18.11 | $21.23 | |
| Services | $6.11 | $8.72 | |
| Live Pet Purchases | $2.01 | (included with supplies) | |
| $72.56 | $78.6 | $86 |
Assuming the truth is somewhere in the middle of the numbers above, we think it is safe to say that US consumers spend approximately $79 billion on pets in 2018, the average of the three totals above
Pet Technology Industry
The Pet technology industry is primarily a subset of the $16 – 20 billion Supplies/OTC medicine category. This category includes items such as beds, leashes, collars and other durable goods (durable goods are items not for immediate consumption such as food and medicine.)
Packaged Facts found that durable tech products reached $400 million in sales in 2017.
However, we define the pet tech category more broadly and also include apps, pet services, various pet health offerings, and subscription & food products. Our definition of the pet technology industry includes companies whose core business uses technology to serve their pet-owning customers. Below are the 9 categories that comprise the pet tech industry
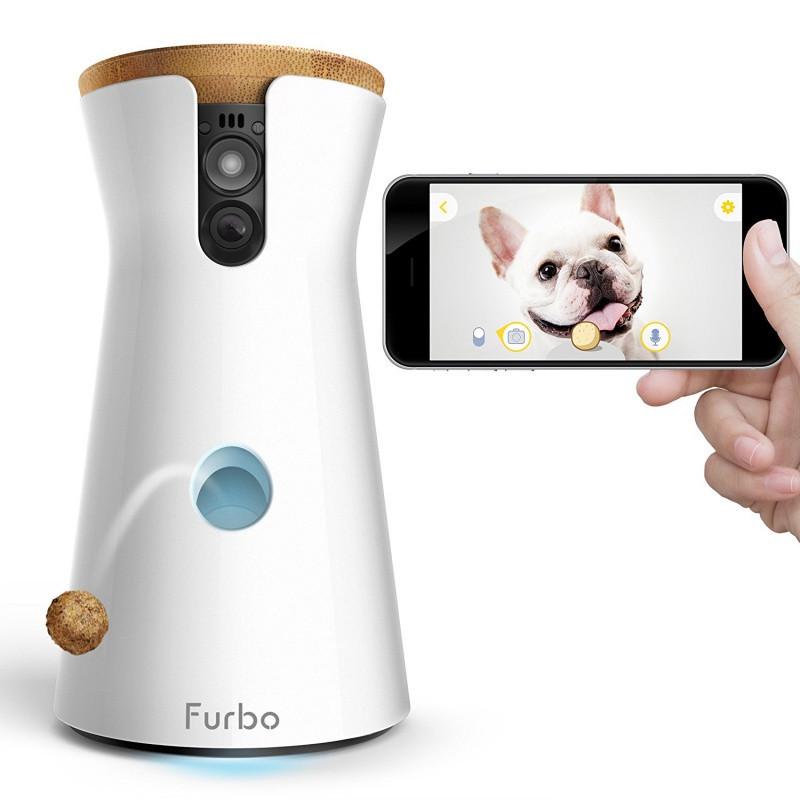
Pet Cameras
- Furbo
- Petcube
- Petzi
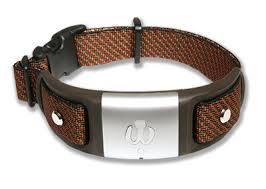
Pet Trackers
- Whistle
- Fitbark
- Findster
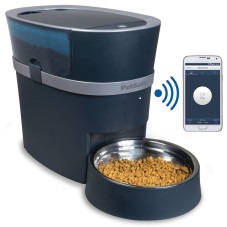
Smart Feeders
- Petnet
- PetSafe
- SureFeed
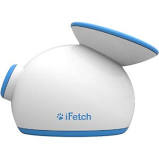
Tech Toys
- Petronics
- iFetch
- GoBone
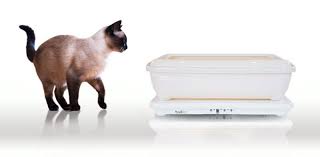
Misc Gadgets
- CatGenie
- SureFlap
- iCalmDog
Apps
- Pawprint
- BabelBark
- PetCoach

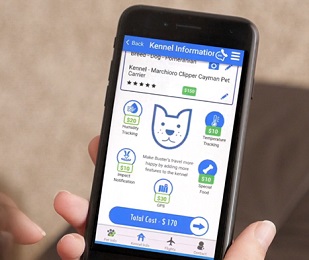
Pet Services
- Rover
- Wag
- DogBuddy

Pet Health
- PetCoach
- VetsFirstChoice
- Wisdom Panel
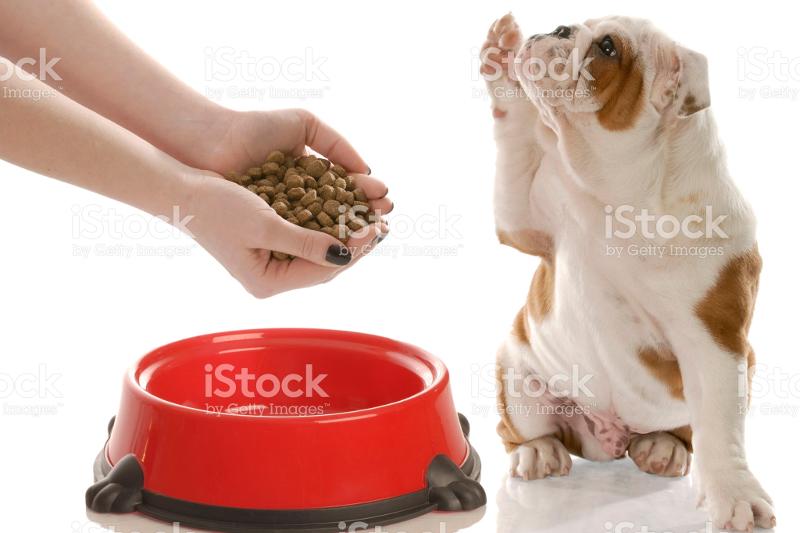
Subscription & Food
- BarkBox
- Ollie
- PetFlow


| My Dog is a Robot covers the pet technology industry. Keep up with the latest news about products, services and companies in the pet tech space. | Contact Us |